Wednesday, January 30, 2013

Anecdotes vs. the Fed

As the S&P 500 Index nears its all time high of 1,565, anecdotal evidence of an imminent top keeps piling up.   This past weekend, the front page of the New York Times had an article on small investors getting back into the market.  CNBC has their little bugs in the bottom right of the screen with how many points to go to the all time high.  It is hard to find a bear on the major financial news outlets.  Bill Gross, Dan Fuss and Jeffrey Gundlach are moving into equity management.  (Okay maybe not this last one, since they are all smart guys and after all how much more can you squeeze out of bonds with the ten year Treasury around 2%?  But the others definitely qualify.)

Against this stands the Fed and many of the other central banks of the world.  By nailing short term rates to zero and doing their best to keep the rest of the yield curve as close as possible, they have been trying to force investors out on the risk curve.  As the Ned Davis chart below shows, it appears that they are finally succeeding.  After years of outflows, equity funds have experienced large inflows so far this year.
 
Source: Ned Davis Research
While there are many reasons that the market should not go up, it continues to defy the skeptics.  The main reason appears to be the unrelenting liquidity supplied by the Fed and now supplemented by individual investors.  It is apt that this week surfer Garrett McNamara possibly broke his own record by riding a an approximate 100 foot (30 meter) wave.

Source: Guardian

In many ways, staying invested in this market is similar.  Both are powered by huge amounts of liquidity, can take you a lot further than you think, it is an exhilarating ride, and can end either in glory or disaster. 
"You can't stop the waves, but you can learn to surf"
John Kabat-Zinn

 Learn to surf (investments).

Monday, January 28, 2013

S&P Nears All Time High. What's The Plan?

The markets have been on quite the tear recently.  The S&P 500 Index finished above 1,500 on Friday and is within 5% of its all time high.  Good news abounds and investors seem very optimistic(see Is the Whole World Bullish?).  So what does this mean for your portfolio?  Is it time to dive in with both feet?  Or is it time to take some funds off the table? 
 
There are two opposing possibilities at play here.  The bullish case is that we are only in the early stages of a long run bull market in stocks and is supported by two main pillars.  The first is that the 'Great Rotation', the shift back into equities by the retail investor, has begun.  The big inflows into equity mutual funds and ETF's this January after years of outflows are brought out as evidence of this.  The second pillar is that the secular bear market, that started in 2000 is over.  A good summary of this case was tweeted in early January by noted technician Ralph Acampora,  who continues to be bullish. 
 
The bearish case has multiple pillars.    The Shiller 10 year adjusted P/E is still over 20, Europe's structural problems continue,  the US faces increased regulation and legislative gridlock, Japan is initiating a new currency war, the UK is on the verge of a triple dip recession and S&P 500 earnings, while better than expected are barely growing.  At the same time everyone is getting optimistic, so it must be time for a correction.
 
So what to do?  Remember, it all comes back to you and what works for you and what your goals are.  As in most cases, it is better to have a plan in place in case of emergency than to have to think one up as the world falls apart. The same is true of investments.  If you don't have a plan in place, make sure your advisor does.  And make sure you are both on the same page about it.  If not, get a plan in place. 
 
First I would check to make sure that your portfolio's overall asset allocation is in line with your planned targets.  If not, rebalance back to them.  The next step is where looking at investments through multiple time frames comes in handy.  So as not to miss the potential for a long term advance, I would leave long term core positions in place. This is because while long term stock P/E's are expensive, as the old Wall Street saying goes "Markets can stay irrational longer than you can stay solvent."  Alan Greenspan's 'Irrational Exuberance" speech was in 1996.  The markets continued to go up until 2000.  And you don't want to miss that type of ride.  Also, what if the bulls are right and we are in the beginnings of a secular bull market?  The last one went from 1982 to 2000.  And you definitely don't want to miss that ride. 
 
But what if the bears are right?  For that scenario, any short term, trading, or tactical positions should be reviewed and possibly have their risk management parameters adjusted.  In addition, I would be very careful about initiating new positions at this point.  Particularly any marginal ones.  A 5-10% stock market correction could offer a better entry point.  That does not mean don't buy anything at all, it just means you should be more selective and only initiate positions in those investments with truly compelling reward-to-risk ratios.  Anything close to a previously researched upside exit point, would be on a very, very short leash, so as to preserve the gains.   
 
By having a plan and looking at the markets through multiple time frames, it is much easier to block out alot of the constant noise from the street and achieve your financial goals.  What's your plan?


Thursday, January 24, 2013

Correlations: Static vs Rolling

Diversification is an indispensable tool in creating a portfolio.  It is often described as the only free lunch in investing.  This is because it offers the opportunity for higher returns and lower risk by combining different asset classes that move in different ways.  This offers the opportunity to rebalance and smooth out the returns of a portfolio.

A key building block is the correlation between asset classes.  This measures how asset classes move in relation to one another.  The table below shows five year asset correlations through 1/23/13 for various asset classes as represented by ETF's.
 
    TIP GLD AGG EMB USO GSG VNQ RWX EEM EFA VB VV
iShares Barclays TIPS Bond Fund TIP                        
SPDR Gold Shares GLD 0.21                      
iShares Barclays Aggregate Bond AGG 0.54 0.11                    
iShares JPMorgan USD Emerging Markets Bond EMB 0.13 0.1 0.17                  
United States Oil USO -0.08 0.3 -0.09 0.13                
iShares S&P GSCI Commodity-Indexed Trust GSG -0.05 0.33 -0.09 0.16 0.92              
Vanguard REIT Index ETF VNQ -0.23 0.01 -0.18 0.14 0.38 0.37            
SPDR Dow Jones Intl Real Estate RWX -0.13 0.11 -0.06 0.28 0.5 0.52 0.69          
iShares MSCI Emerging Markets Index EEM -0.21 0.13 -0.13 0.21 0.55 0.56 0.75 0.83        
iShares MSCI EAFE Index EFA -0.19 0.13 -0.06 0.22 0.54 0.55 0.74 0.89 0.92      
Vanguard Small Cap ETF VB -0.22 0.04 -0.16 0.22 0.49 0.49 0.85 0.82 0.86 0.87    
Vanguard Large Cap ETF VV -0.24 0.05 -0.12 0.23 0.52 0.52 0.83 0.85 0.91 0.93 0.95  
Vanguard Mid-Cap ETF VO -0.22 0.07 -0.13 0.23 0.53 0.54 0.84 0.84 0.9 0.91 0.97 0.98
Source: AssetCorrelation.com


Correlations are measured from -1 to +1.  Negative numbers mean that over that 5 year span, the asset classes moved in opposite directions, while positive numbers mean they moved in the same direction.  The closer to -1 or +1, the more strongly they move together.  As an example, the Vanguard Large Cap ETF (VV) has a -0.12 five year correlation to the iShares Barclays Aggregate Bond ETF (AGG).  This means that over those five years, they have a weak negative correlation and moved somewhat in opposite directions.  Therefore, having the two ETF/asset classes in the portfolio should help lower the risk. 

However, what most people forget is that correlation is not a static number.  It changes over time.  Below is a chart showing the correlation between the two ETF's over the same five years.


As you can see, the correlation was very rarely at -0.12 over that time.  It ranged from -0.84 on August 17, 2011 to +0.58 on September 11, 2010 and appears to have spent much of its time closer to -0.50 than -0.12.  What this shows, is that while most of the time, the AGG has been a very good diversifier for VV, there are times when they both move in the same direction, sometimes strongly so.  This is not necessarily bad, as they could both be moving up together, instead of down, but they are not acting as you would expect from just the static correlation figure. 


Wednesday, January 23, 2013

The S&P 500 Index has had a strong start to the year so far up 4.65% through January 22. 


Source: StockCharts.com

However, the party may be getting ready for at least a little pullback as the entire market has entered overbought territory with the Relative Strength Index (RSI) over 70.  In addition, as seen in the chart below from Bespoke Investment Group, almost 80% of individual stocks in the S&P 500 Index are overbought.  Prior history says it doesn't stay this overbought long. 


These are more causes to worry in addition to those mentioned in Why I am worried on the Humble Student of the Markets blog yesterday.  The overbought condition can be worked off either through a correction in the market, or by moving sideways for a while.  The question is what will the market do?

Tuesday, January 22, 2013

Weekend Update (No Not that One)

Some interesting items came out since I last posted and I wanted to update you on them.  First was this weekend's Barron's Roundtable.  The diversity of experience of the members provides for some good back and forth on a variety of issues.  Since most manage money for a living, they are talking their book so to speak, but also have skin in the game.  Felix Zulauf who runs his own hedge fund in Switzerland was particularly bearish.  Aside from that, two points particularly got my attention.  The first was:
They aren't making it up out of thin air. Bond markets in Europe are doing better.

Zulauf: Bond markets in Spain and Italy and Greece were priced for calamity. The ECB stepped in and removed that threat. That made bond markets rally and interest rates fall. The decline in interest rates is just about over. Yields in those countries will trade sideways for a few months and then start rising again.

This highlights how important valuation is in investing.  The situation may be horrible as it was in Europe, but the securities were pricing alot of that in.  So now that investors have gone from pricing in a complete disaster, to simply a recession, those that bought when things were very dark have been able to make a significant profit.  The second point was:
Gross: Can the Japanese government generate nominal GDP? Can it produce inflation of a positive sort that will generate corporate profits?
 
Zulauf: GDP has been stagnant in nominal [noninflation-adjusted] terms for 20 years. The price for generating growth is higher indebtedness. In the past 22 years, the market capitalization of Japanese stocks has fallen by 75%. The capitalization of the bond market has risen by four times. A major reallocation from bonds to stocks is beginning. I would be surprised if the Japanese stock market didn't rally 50% in the next two years. The best instrument to play this trend is a currency-hedged exchange-traded fund listed in the U.S. It is the WisdomTree Japan Hedged Equity fund, or DXJ. It trades for $38.53.

 
While I generally take a contrarian viewpoint to things, in this case it is reassuring to be on the same page as such a successful investor. 

Over on The Reformed Broker, Joshua Brown mentions how Alliance Bernstein, believes equities are about to break out of their bear trap.  The charts on US housing and Chinese electricity production both show nice rebounds from downtrends.


Source:  Alliance Bernstein

Today's post, Why I am worried from Cam Hui of the Humble Student of the Markets blog is a great illustration of the varied components that go into investing and trading.  It also reminds you to keep in mind all of the risk and counterarguments to your own point of view.  As he sums it up at the end:
My inner trader tells me that these sorts of things don't seem to matter to the market until the market starts to pay attention, so I should relax and enjoy the bullish party. My inner investor is watching very closely for signs of weakness, particularly from the US consumer which could derail this rally.
Smart words.

Wednesday, January 16, 2013

Japan?

Even after today's pullback, the Nikkei 225 Index is up over 22% since November 14, 2012. This is due in large part to the election results that brought the Liberal Democratic Party back to power. Since then Prime Minister Shinzo Abe has announced 10.3 trillion yen ($116 billion) in additional stimulus and continues to pressure the Bank of Japan to double its inflation target to 2%. Meanwhile, valuations such as price to book are significantly lower than average and earnings are expected to grow almost 50% this year.


Responding to expectations of more quantitative easing from the Bank of Japan, the yen has declined by approximately 11% over the same time period. This should be a big boost to Japan's export led economy.


In the short term, both the Nikkei and Yen appear overextended and should experience a pullback, which may have started today. While Japan faces both a large debt load and an aging population, the current combination of stimulus, expected quantitative easing, low valuations and earnings growth should allow for a further advance. The 12,000-12,300 area (or approximately 13-15% higher), would appear to be the first target.
 
However, as with all international investments you have to take into account the effect of the currency. In this case, a depreciating yen, while helping Japanese exporters, would hurt international investors as they translate their holdings back to their home currencies cancelling out some if not all of the benefit from the rising market. Therefore it is critical to hedge the currency effect away. Institutional investors can easily do this in the futures markets. Individual investors can do this by purchasing an ETF that tracks a Japanese stock index and then hedges out the currency.

Of the twelve Japanese equity ETF's I quickly found using the screener on www.etfdb.com only two indicate they are hedged, the Wisdom Tree Japan Hedged Equity Fund (DXJ) and the db-x MSCI Japan Currency Hedged Equity Fund (DBJP). Of the two, the DXJ has a lower expense ratio, more assets, and more liquidity. (Full disclosure I own DXJ ).

To illustrate the difference, below is a chart of the non-hedged iShares MSCI Japan Index ETF (EWJ). It is up 12.9% since November 14, 2012. A very nice return for two months, but below that of the Nikkei. Some of this is the difference in indexes, but the majority is due to the 11% drop in the yen.

 
For the same time frame the DXJ is up 22%, or over 9% points more. This is predominately because it has hedged out the effect of a declining yen thus enabling the foreign investor to gain the full benefit of the rising Japanese market.

Monday, January 14, 2013

A Good Start to the Year, but Caution Signs Ahead

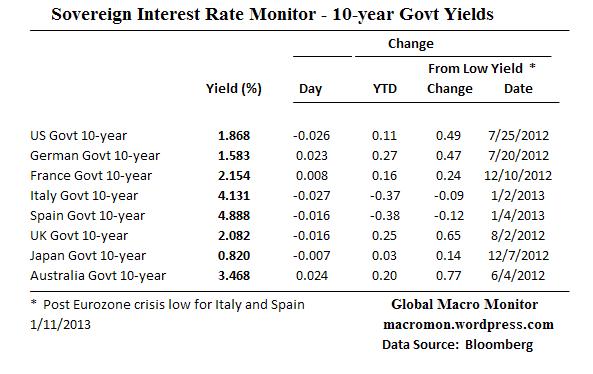
Last week was generally a good one with equity markets generally advancing around the world.  In Europe, Ireland, Italy and Spain all successfully held debt auctions and saw their spreads tighten. 


Source: Global Macro Monitor
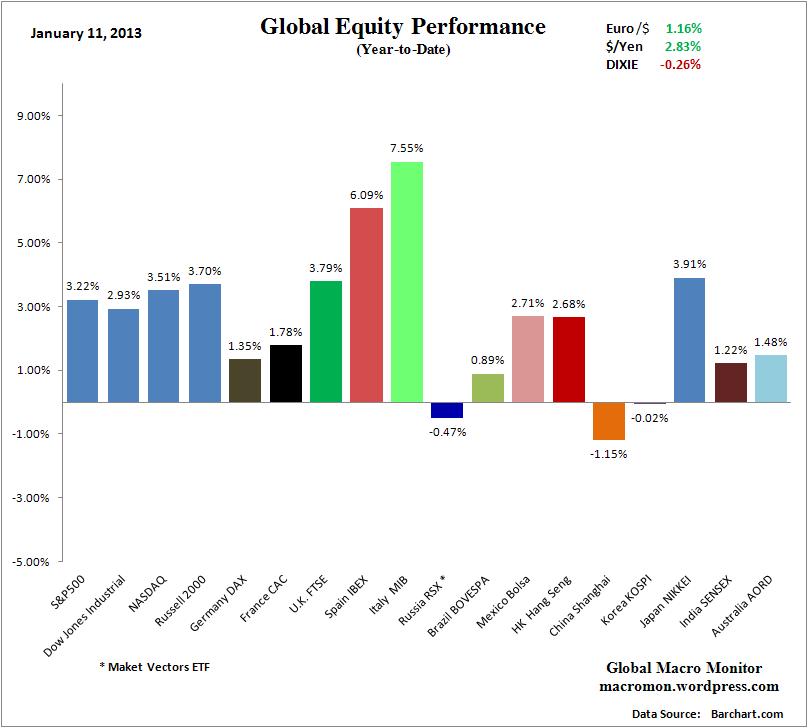
 Feeding off of this, some of the best performing markets year to date are Spain and Italy. 
Source: Global Macro Monitor

As we head into the heart of earnings season watch for changes to company earnings guidance in light of the increased taxes from the fiscal cliff solution.  Both high end (increased taxes) and low end (back to normal Social Security taxes) retailers and vendors might be vulnerable.  We also get some important economic data this week, including PPI, CPI, Industrial Production and the Fed's Beige Book. 
 
At the same time as all of this information is coming in, some indicators are moving into area that investors might be getting a bit complacent.  The AAII % of bears has dropped to 26.9%, while bulls are up to 46.5%.  In addition, according to Thompson Reuters Lipper service individual investors poured over $18.3 billion into stock mutual fund and ETF's last week, the most net new cash, since 2008, and the most into equity mutual funds since May of 2001.  While some of this may be investors coming back to the market after harvesting gains early in front of expected tax increases late last year, it is still disconcerting to see so much cash flow into equities this late in a cyclical bull.  Overly bullish sentiment can leave the market vulnerable to negative news. 
 
Finally, while Europe and Japan do seem to be getting better, the US government is expected to run out of money sometime on the second half of February.  Overall, I am becoming more cautious on the domestic markets as we see how all of this turns out over the next several weeks.

Saturday, January 12, 2013

Funds in the Closet

Barrons and the Wall Street Journal both had pieces on closet indexing and the importance of active management in picking good fund managers today.  It is particularly important in picking large cap US equity funds.  Large cap US equities have long been considered one of the more efficient parts of the stock market, with copious amounts of research coverage, data dissemination and many funds.  In this type of situation, it is difficult to stand out and outperform.  The additional pressure to conform to style boxes for various pension and 401k consultants has compounded the issue.  Staying true to a proven investment strategy (not style) may make it difficult for consultants to neatly categorize a fund or manager and thus eliminate it from consideration.
 
Unfortunately, many fund firms and managers have opted to avoid this issue and become closet indexers.  While claiming active management, these funds do not drift far from benchmark weightings and so never drift too far from benchmark performance.  So in effect, very often investors end up paying for active management and getting index like performance.  While this may satisfy some behavioral aspects of investing (the desire to outperform, the fear of loss), it does not make sense from an economic sense.  A lot of time and effort appear to be wasted researching and explaining why this fund outperformed or underperformed by 25 basis points.  It would be much easier to just buy low cost index funds or ETF's for that purpose and use the time to pick a true active manager that can outperform over time.  Since their portfolios typically do not look like an index, the returns carry much more from the index and can scare an undisciplined investor out.  Therefore, this requires a deep understanding of the investment strategy and discipline to ride it out through the inevitable periods of underperformance.  For retail investors, this is where a skilled and disciplined investment professional can make a difference.  However, you have to be careful in picking an advisor, because they may be susceptible to the same pressures.  If you are looking for active managers and they pick closet indexers for you, you would end up paying twice for something you don't want. 

Thursday, January 10, 2013

Banks and Basel III

A few days ago, global banks won a four year delay in the implementation of the Basel III liquidity coverage ratio.  European banks were up as much as 2.1% that day according to Bloomberg.  While the delay should give the European banks more time to build up their capital ratios, it does bring up a key aspect of the financial/sovereign debt crisis of the last several years.  Leverage.

Leverage was a major factor in the financial crisis in the US in 2008.  While some of this was addressed with capital injections from the federal government (TARP) which were later repaid,  this was not done in Europe.  A recent piece from the OECD highlights this.  There are several ways to measure a banks financial strength.  The ratio of Core Tier 1 Capital to 'risk weighted assets' is one.  The major global banks generally pass this standard.  However, it is subject to questioning, since the issue of how to risk weight the assets is left up to the bank.  Thus sovereign debt assets can be classifed as 'risk free'.  While one can argue that German Bunds and US Treasuries are risk free, it is a much harder case to make for Greek, Portugese, Irish, or Spanish, and Italian bonds.

To eliminate this, you can look at Core Tier 1 Capital to 'unweighted assets' and here the picture is very different.  The european banks face a significant shortfall.  In aggregate, they would need to raise capital equal to over 4.2% of GDP (approximately 400bn euros) to meet the 5% well capitalized ratio.   While Greece being high on the list may not be a surprise, the rest of the chart may be.  The banks of such stronger countries such as France, Germany, Holland and Finland all would need to raise more capital than the 4.2% of GDP average for the Euro area.  In contrast, Spanish and Italian banks would appear to be on much stronger footing. 


Source: OECD

The delay in implementing some of the Basel III rules will help European banks in growing their capital through retaining earnings.  However, it does not get to the heart of the matter, that many of them (particularly in the north) are still highly leveraged and have not raised the capital necessary to assure the markets.  This is part of the reason that european countries have 'kicked the can' down the road so often and been willing to fund bailouts.  Their own banks would have a difficult time handling the fallout.  European banks turning the corner on their capital adequacy, will be a strong sign that the chronic crisis is also turning. 
 

Tuesday, January 8, 2013

A good piece illustrating some of the unintended consequences of central bank intervention in the markets through the 'Bernanke put' and 'Draghi put'

No free lunch for central bankers - Humble Student of the Markets


Monday, January 7, 2013

Some Thoughts on 2013

Relative to 2012, the stock markets enter 2013 facing a period of relative geopolitical calm.  The US presidential election has passed, China had a peaceful power transition and Super Mario appears to have saved the eurozone (at least for now).  Nevertheless, that calm will be relative, as we enter February with the one two punch of the US Debt Ceiling and the Italian elections.  In the US, we will have more grandstanding and brinksmanship, but some sort of deal should be worked out as it has before.  In Italy, while current technocrat Prime Minister Mario Monti and his center left allies are favored, the always interesting Silvio Berlusconi is running again.  Given the political structure, Italy could once again become ungovernable after the election.  This would return turmoil to the third largest economy in the Eurozone.


These two events bring to mind that while the developed markets in general may be cheap relative to their own histories and some even to the rest of the world; many face a daunting list of obstacles that limit those valuations. 


The US and much of Europe face the future needing to confront the aftereffects of the housing bubbles, the banking crisis and the sovereign debt crisis.  This is complicated by their aging demographics, debt burdens (with or without entitlements) and increasing regulatory burden.  Combined these factors describe the conditions of a secular bear market.  Until some/most of these issues begin to get resolved, the P/E expansion of these markets would appear to be limited.  As a reminder, prior secular bears have lasted anywhere from twelve to eighteen years. 


An interesting exception to this general developing market malaise may be Japan.  While generally unnoticed, there were some potentially major changes in Japan last year.   These included the setting of an explicit inflation target by the Bank of Japan and the return of the LDP to power.  Since the election, the yen has dropped sharply in value against the dollar (See chart below of Yen/dollar exchange rate for the last year).  This has been a boost for Japanese exporters.  In addition, the new government is expected to announce a large fiscal ($136bn or 2.5% of GDP) stimulus package to help kickstart growth.  Combined with low valuations and expectations, this could be very interesting.  While only time will tell if this is the start of Japan finally leaving its lost decades, or simply another failed attempt to do so, Japan is definitely one market to watch in 2013.  


The emerging markets are a different story.  In general, they have favorable demographics, solid finances and a strong backing for deregulation and growth.  These are conditions for a secular bull markets.  While some are no longer cheap relative to the rest of the world or their own history, many still are and offer plenty of opportunity. 


 Source: JPMorgan Funds