Showing posts with label SP 500. Show all posts

Wednesday, April 3, 2013

It Finally Happenned

It took until the final day of the quarter, but the S&P 500 put in a new all time high closing at 1,569 on March 28th. 


Source: StockCharts


It has taken a while for the S&P 500 to reach these levels again.  This chart from JPMorgan should help put things in perspective.


When the S&P 500 first reached these levels thirteen years ago, it was trading at a forward P/E of 25.6 and competing with a ten year Treasury yield of 6.2%.  Now, the forward P/E is 13.8 and the ten year yield is 1.9%.  So as we have worked through the excesses of the tech, real estate and finance bubbles, overall corporate earnings have continued to grow.  This has made valuations more reasonable and therefore stocks relatively less risky.  At the same time, yields have come down lessening their attractiveness.  With the Fed committed to its current low interest rate policies (think liquidity wave) until unemployment reaches 6.5%, there is no reason to think this relative attractiveness should change any time soon (baring some geopolitical black swan). 

Since making new highs, the S&P500 has since pulled back a little.   While a weaker than expected gain in jobs from the ADP report today was the reason cited for the pullback, a consolidation after reaching new highs is not too surprising.  In addition, investors are anticipating announcements from the Bank of Japan and the European Central Bank Thursday and US employment data on Friday morning.   All potentially market moving events. 

While forecasts of EPS growth have been shrinking, the forward P/E of under 14 does not scream overvalued.  On a positive note, Markit and JPMorgan announced that the JP Morgan Global PMI increased to 51.2 for March from 50.9.

Source Markit JPMorgan
 
Given its large international exposure, the S&P 500 is highly correlated to global growth.  The increase in global PMI is a good sign for better earnings in the future.  While Europe remained a drag, the US continued its growth, the rate of expansion accelerated in China and Japan saw the first growth in ten months. 

Source: StockCharts

While Japanese manufacturing might have seen growth in March, the Nikkei has been consolidating after a large run up since mid November.  Some of this is a function of a short term strengthening of the yen due to increased tensions with North Korea.  In any case, a weaker yen is critical for an export led economy such as Japan's.

Chart forUSD/JPY (USDJPY=X)

New Central Bank Governor Haruhiko Kuroda will lead his first meeting on Thursday.  With the Nikkei approaching its 50 Day moving average the markets will be watching closely for signs of continued commitment from the BOJ to bringing the yen down and bringing inflation up.  A perceived lack of commitment would probably be seen as a time to take profits in the Japanese markets.

Meanwhile in Europe, the resolution of the Cyprus banking crisis, has led to continued talk of contagion by pundits.  So far calm seems to be prevailing as both Italian (4.62%) and Spanish (4.94%) ten year yields closed below five percent.  The pressure seems to be releasing through the decline in the Euro (and drops in the Italian and Spanish stock markets). 

Chart forEUR/USD (EURUSD=X)
The ECB meeting tomorrow may help shed some light on the situation.

Thursday, March 14, 2013

Still Risk On

Risky assets have been on the move lately.  This can be seen in multiple asset classes.  The first sign that we are in a Risk On environment is the widening of spreads on US Treasury Debt versus other governments' debt.  US Treasuries are considered by many the ultimate safe haven and so tend to enjoy a premium when investors are worried.  The premium shrinks or disappears when the worries go away.  

Source: Wall Street Journal
The second sign is the S&P 500 Index's relentless move towards new highs.  The last high was 1,565 in 2007.  We are less than one percent away.


Source: StockCharts.com
With earning's growth expected to be minimal, this has brought up Price Earnings ratio, but not to exorbitant levels. 

Source: Dr. Ed's Blog

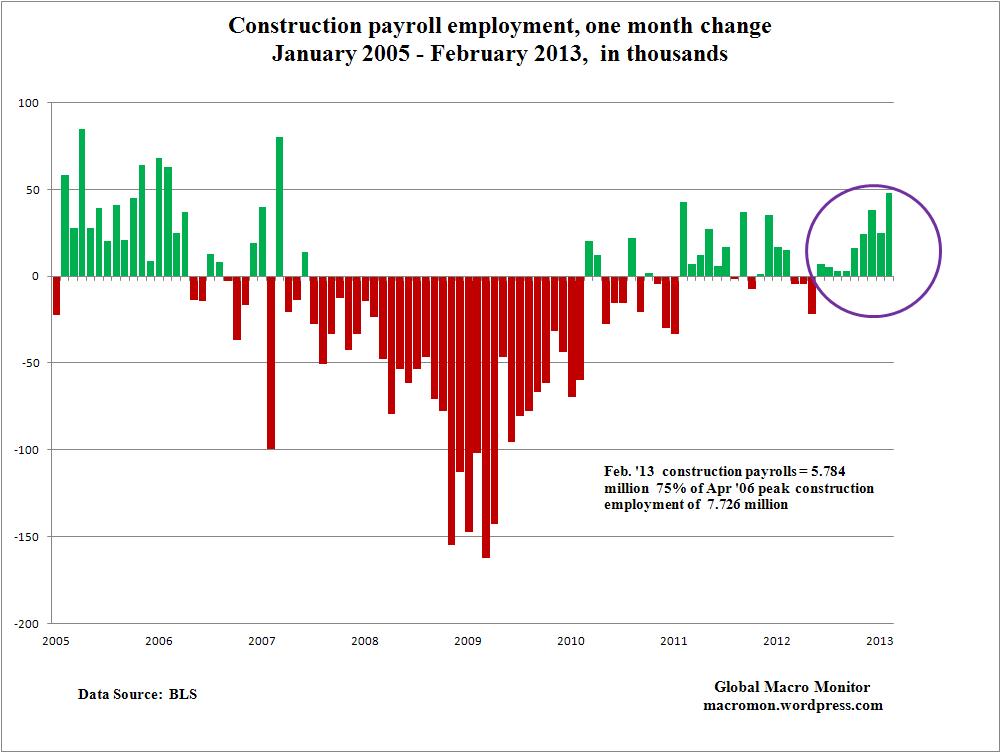
On the economic front, while the 'fiscal cliff' and 'sequester' would appear to have taken away much of our margin for error on the growth front, there are positive signs coming from the private sector.  Construction employment, which tends to pay well, is coming back, along with the housing market.  And both would appear to be still early in the game.


On a more global and esoteric note, South Korean exports, which tend to be a leading indicator of global exports, are growing.  This is despite the increased geopolitical tensions on the Korean Peninsula.  North Korea recently cancelled the Korean War ceasefire and cut off the hotline to South Korea.

Source: Humble Student of the Markets


Other signs of healing include Ireland's first successful ten year debt auction since 2010, Spanish and Italian ten year yields both nicely under 5%, and yields on 'junk' bonds hitting a record low of 5.56%.  Overall, investors seem to be taking a positive view of things.  With things relatively calm on the investment front, I would urge you to make sure you know what your goals are for your investments, what the time frames for those goals are and have a plan in place and know what you will do given different scenarios.  It is much easier and better to do this without the influence of sharp emotions and media hype.

In Japan meanwhile, the Nikkei continues to move up.

Source:StockCharts.com

With the Yen moving down at the same time, the currency affect needs to be hedged out.  While it does not track the Nikkei, the Wisdom Tree Japan Hedged Equity Fund (DXJ)* does hedge out the currency risk and has been a good way to play this rise. 
 
Source: StockCharts.com

While DXJ has moved up significantly since the middle of November, the valuations are just reaching the average for the last five years:

Source:ETF Research Center


Source:ETF Research Center
 
While the speed and size of the move would indicate caution, the valuations would indicate, that there is still more room to go before we get into overvalued territory.  That DXJ has increased  almost 40% in approximately 4 months and has only now reached its average valuations for the last five years, gives an indication of how far sold it was.  Currently, allof this has been based on the election results, statements, intentions and the nominee for Bank of Japan Governor.  We have not seen much hard action.  The situation needs to be watched carefully for continued follow through and success on the part of the Japanese authorities and economy.


*Disclosure: I own DXJ and some vertical call spreads on DXJ in my accounts.

Monday, February 18, 2013

President's Day Update

I hope everyone had a good weekend and is enjoying the added day of market respite this President's Day.  Last week was mixed on the economic front.  On the plus side, housing inventory and unemployment claims both dropped in the US.  On the negative side, so did industrial production.  The big news was the return of M&A on a big scale, with Warren Buffett's Berkshire Hathaway taking Heinz private and American and US Airways coming together to form the world's largest airline.  For all of that, the S&P 500 Index was roughly flat for the week.

Looking ahead, this holiday shortened week has some interesting data points.

Tuesday:      German ZEW Survey         
Wednesday: US Housing Starts, PPI and Fed minutes, German and French CPI, Chinese Flash PMI
Thursday:    US Jobless Claims and CPI
Friday:         German GDP and IFO Survey
Sunday:       Italian elections

The two German surveys should give us insights into the state of that economy, as should the Chinese Flash PMI.  Here in the US, housing starts, Fed minutes and jobless claims will draw alot of attention.  With the Italian 10 year yield down 12 basis points (bps) YTD and spreads 45 bps tighter versus German bunds through Friday, the markets seem to anticipate at worst a neutral result to Sunday's Italian election, but we will need to see.  On Monday, the European markets did appear to get uneasy about the probable election results.  As they say, that is why they play the game.  

While the G-20 declared that they will refrain from competitive devaluation, there does seem to be a distinct benefit to a lower currency for ones stock market.


Both the UK and Japanese markets with their falling currencies are doing about ten percentage points better than Brazil with its strengthening currency, the real.  On Monday, with a seeming all clear from the G-20, the trend continued.  In Asia, the Nikkei was up over 2% as the yen fell to almost 94 to 1$US.  In South America, the Brazilian stock market (the Bovespa) fell another 50bps as the real rose against the dollar. 

On another front, correlations between various risk based asset classes have been coming down indicating some differentiation between them, as opposed to a blind risk on/risk off trading environment.  The chart below shows the trailing 24 month correlations between various asset classes as of 2/17/13 as represented by ETF's.  The red cells show high positive correlation.
Source: AssetCorrelation.com

The chart below shows the one month trailing asset correlations:


Source: AssetCorrelations.com


You can see how the dark red area has shrunk significantly, with even Emerging Market (EEM) correlations falling under 0.7 to the Real Estate indexes and the US stock market indexes.  While we are still subject to headline risk (Sequester, Italian elections, etc.) this is a healthy development as it indicates investors are differentiating more on the basis of each asset class' underlying fundamentals, rather than on the latest headlines.

Wednesday, February 13, 2013

Mid Week topic update

US and the Liquidity Wave

Despite all of the concerns, the S&P 500 Index (1,519 close 2/12/13) continues on its seeming date with destiny at its all time high of 1,576. 
Source: StockCharts.com


The liquidity wave continues to push the market higher.  In addition, there are some signals that there may be a structural shift in risk taking going on.  This would support the wave further than many expect.  On the negative side we have the usual cast of suspects, including slowing earnings growth, higher taxes, higher gasoline prices etc.  To these we should add the austerity risk; that the federal budget deficit has never fallen as fast as it is now without a coincident recession.  We never said riding this big wave would be easy. 

Japan

About a month ago, I mentioned that the Japanese stock market was up about 22% from November 14th.  After a short consolidation period, it has continued its upward trend and is now up about 31% from November 14th.

Source:StockCharts.com


A good part of this gain has been based on the drop in the yen. 

Source: Yahoo Finance


With the yen dropping against the dollar, it is important to hedge this out.  The Wisdom Tree Japan Hedged Equity Fund (DXJ) is one way to do this.  Comparing the returns for the DXJ and the iShares MSCI Japan Index Fund (EWJ) which is unhedged can illustrate how important this is.

Source: StockCharts.com


While the two track different indexes, DXJ was able to approximately double EWJ's return because it hedged out the currency depreciation.  For another way to see the effects of the yen on click here. 

On top of this, the Japanese government is now taking a page out of the Fed's playbook and specifically targeting asset prices.  This past weekend, Japan's Economic Minister Akira Amari said:

“It will be important to show our mettle and see the Nikkei reach the 13,000 mark by the end of the fiscal year (March 31),”
 
This is about another 15% from current levels and a full 50% from it November 14th close.  That would be quite the move in four and a half months.  Yet another fun wave to ride.

Monday, January 28, 2013

S&P Nears All Time High. What's The Plan?

The markets have been on quite the tear recently.  The S&P 500 Index finished above 1,500 on Friday and is within 5% of its all time high.  Good news abounds and investors seem very optimistic(see Is the Whole World Bullish?).  So what does this mean for your portfolio?  Is it time to dive in with both feet?  Or is it time to take some funds off the table? 
 
There are two opposing possibilities at play here.  The bullish case is that we are only in the early stages of a long run bull market in stocks and is supported by two main pillars.  The first is that the 'Great Rotation', the shift back into equities by the retail investor, has begun.  The big inflows into equity mutual funds and ETF's this January after years of outflows are brought out as evidence of this.  The second pillar is that the secular bear market, that started in 2000 is over.  A good summary of this case was tweeted in early January by noted technician Ralph Acampora,  who continues to be bullish. 
 
The bearish case has multiple pillars.    The Shiller 10 year adjusted P/E is still over 20, Europe's structural problems continue,  the US faces increased regulation and legislative gridlock, Japan is initiating a new currency war, the UK is on the verge of a triple dip recession and S&P 500 earnings, while better than expected are barely growing.  At the same time everyone is getting optimistic, so it must be time for a correction.
 
So what to do?  Remember, it all comes back to you and what works for you and what your goals are.  As in most cases, it is better to have a plan in place in case of emergency than to have to think one up as the world falls apart. The same is true of investments.  If you don't have a plan in place, make sure your advisor does.  And make sure you are both on the same page about it.  If not, get a plan in place. 
 
First I would check to make sure that your portfolio's overall asset allocation is in line with your planned targets.  If not, rebalance back to them.  The next step is where looking at investments through multiple time frames comes in handy.  So as not to miss the potential for a long term advance, I would leave long term core positions in place. This is because while long term stock P/E's are expensive, as the old Wall Street saying goes "Markets can stay irrational longer than you can stay solvent."  Alan Greenspan's 'Irrational Exuberance" speech was in 1996.  The markets continued to go up until 2000.  And you don't want to miss that type of ride.  Also, what if the bulls are right and we are in the beginnings of a secular bull market?  The last one went from 1982 to 2000.  And you definitely don't want to miss that ride. 
 
But what if the bears are right?  For that scenario, any short term, trading, or tactical positions should be reviewed and possibly have their risk management parameters adjusted.  In addition, I would be very careful about initiating new positions at this point.  Particularly any marginal ones.  A 5-10% stock market correction could offer a better entry point.  That does not mean don't buy anything at all, it just means you should be more selective and only initiate positions in those investments with truly compelling reward-to-risk ratios.  Anything close to a previously researched upside exit point, would be on a very, very short leash, so as to preserve the gains.   
 
By having a plan and looking at the markets through multiple time frames, it is much easier to block out alot of the constant noise from the street and achieve your financial goals.  What's your plan?